

edgeMED Help Center > Practice Management > Billing
Aging report.
Select a topic below or scroll through the page for the all content.
Generate aging reports as a period in time and access them anytime. edgeMED’s aging report provides great flexibility to generate and store it in the view that you prefer.
Create an Aging Report

Click the Reports tab and click Aging Report.
Select the Date Type as Service Date or Batch Date. You may also change the Date To and Date From if needed.
To generate the report, click on Run Report.
You will see the new report listed as Pending. When the report is generated, click on View Report to view the report.
Understand the Report

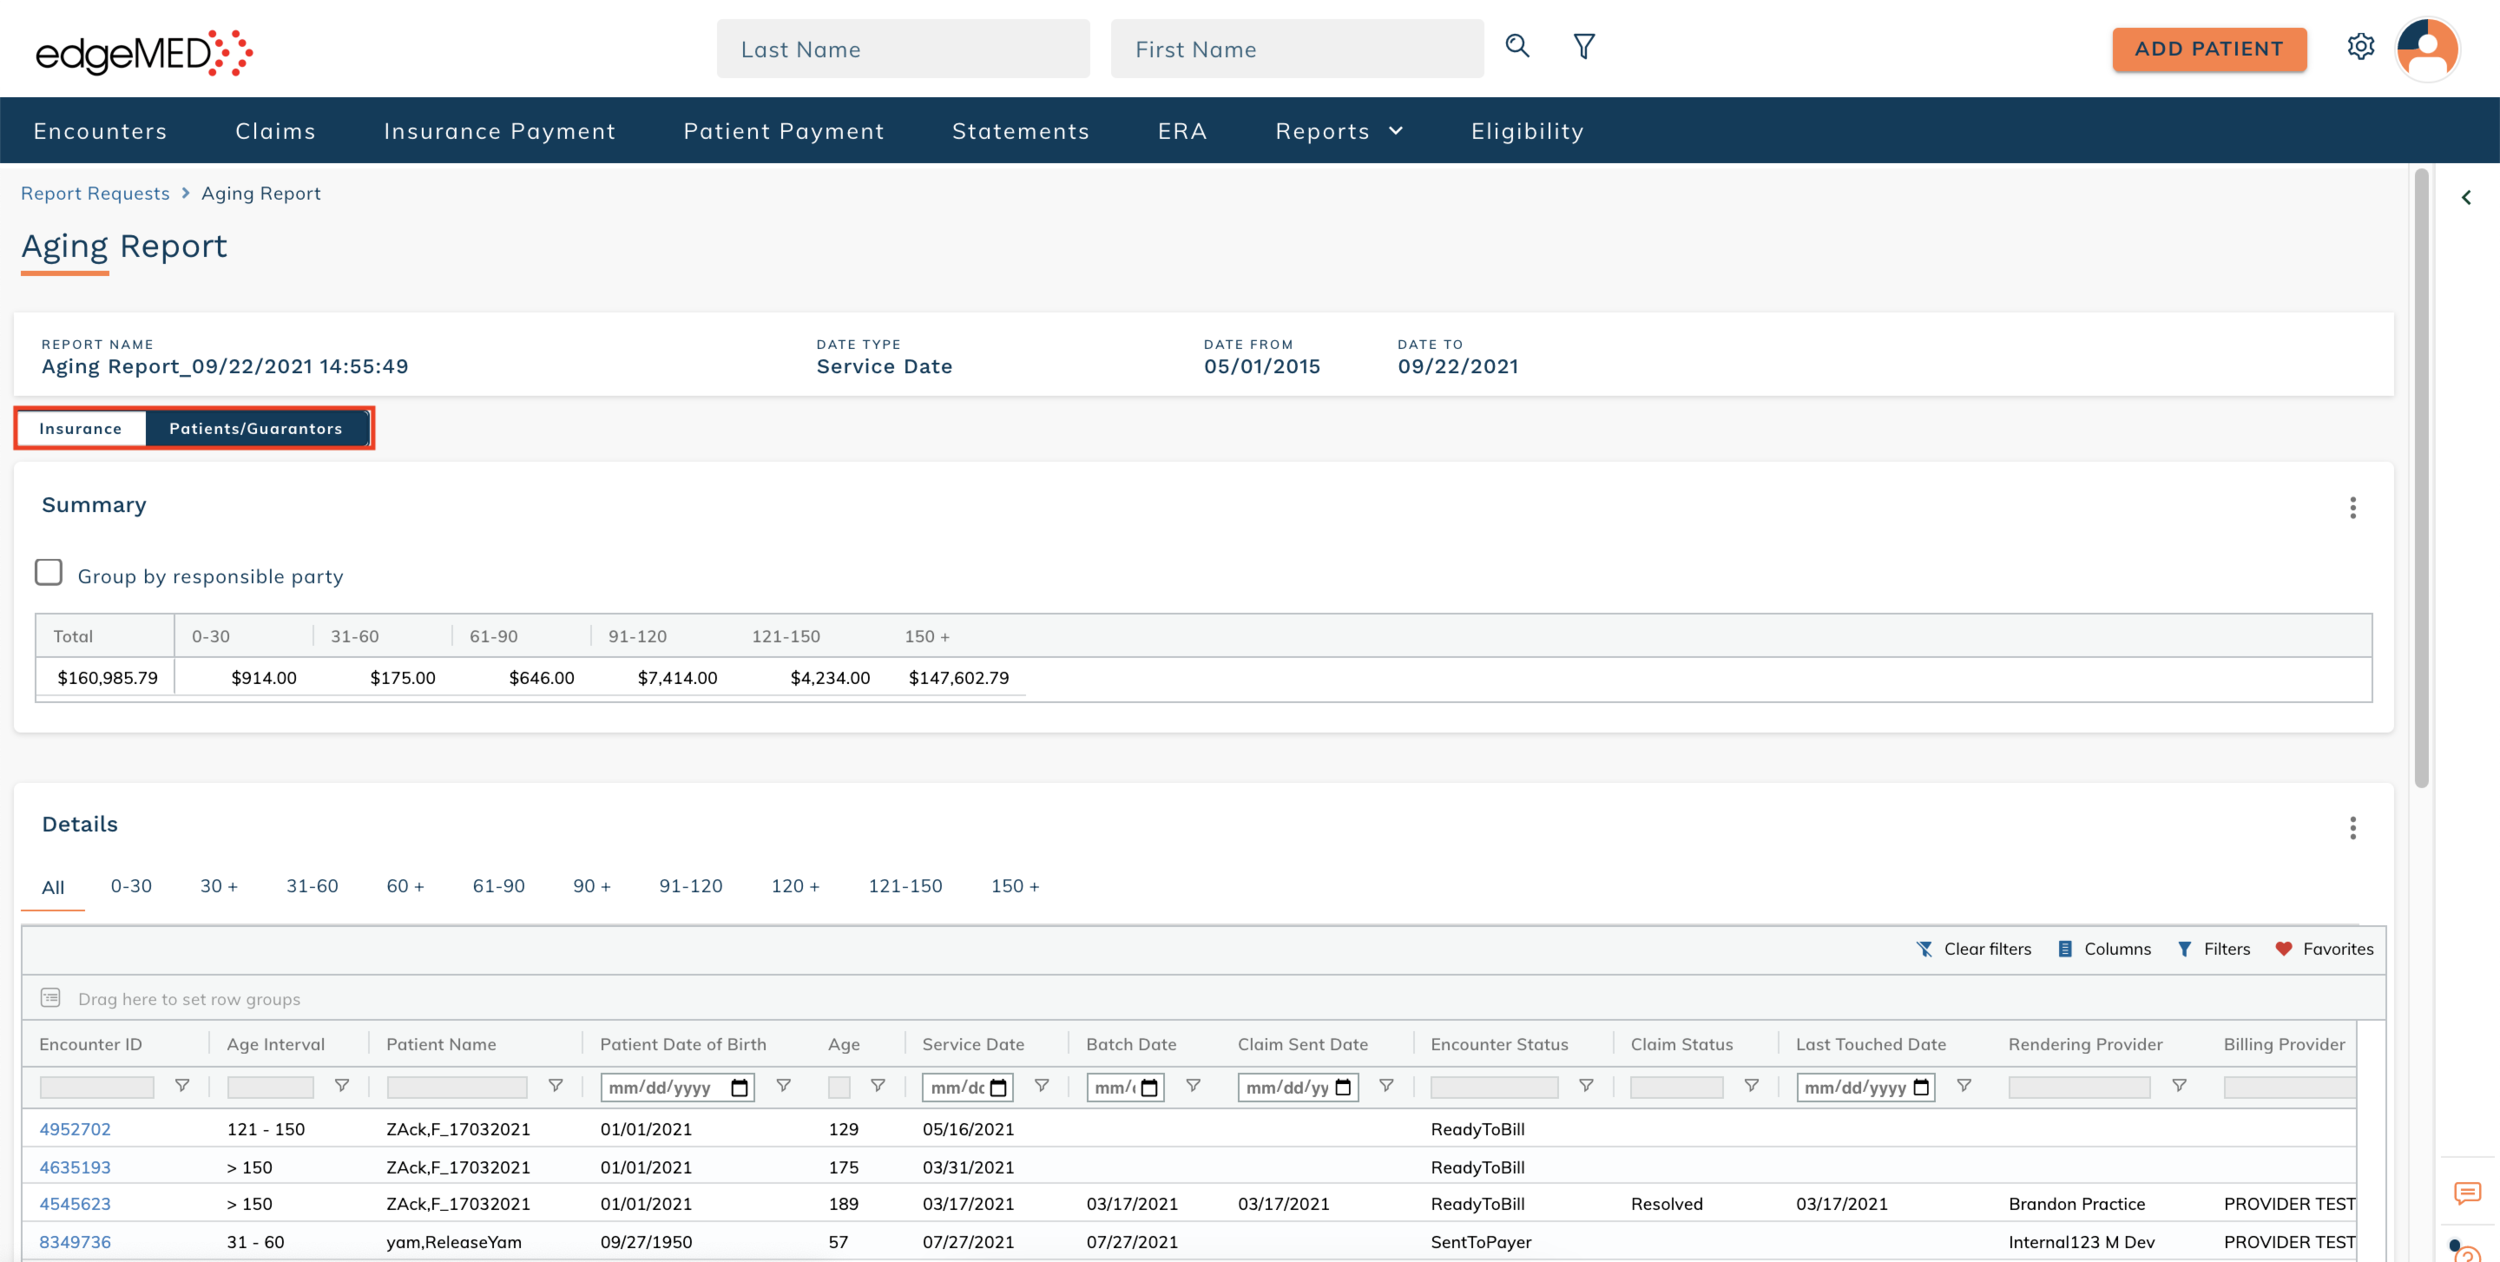
Click View Report.
The Toggle of the Aging Report will be on the Insurance side by default. The Aging Report will display the insurance aging data.
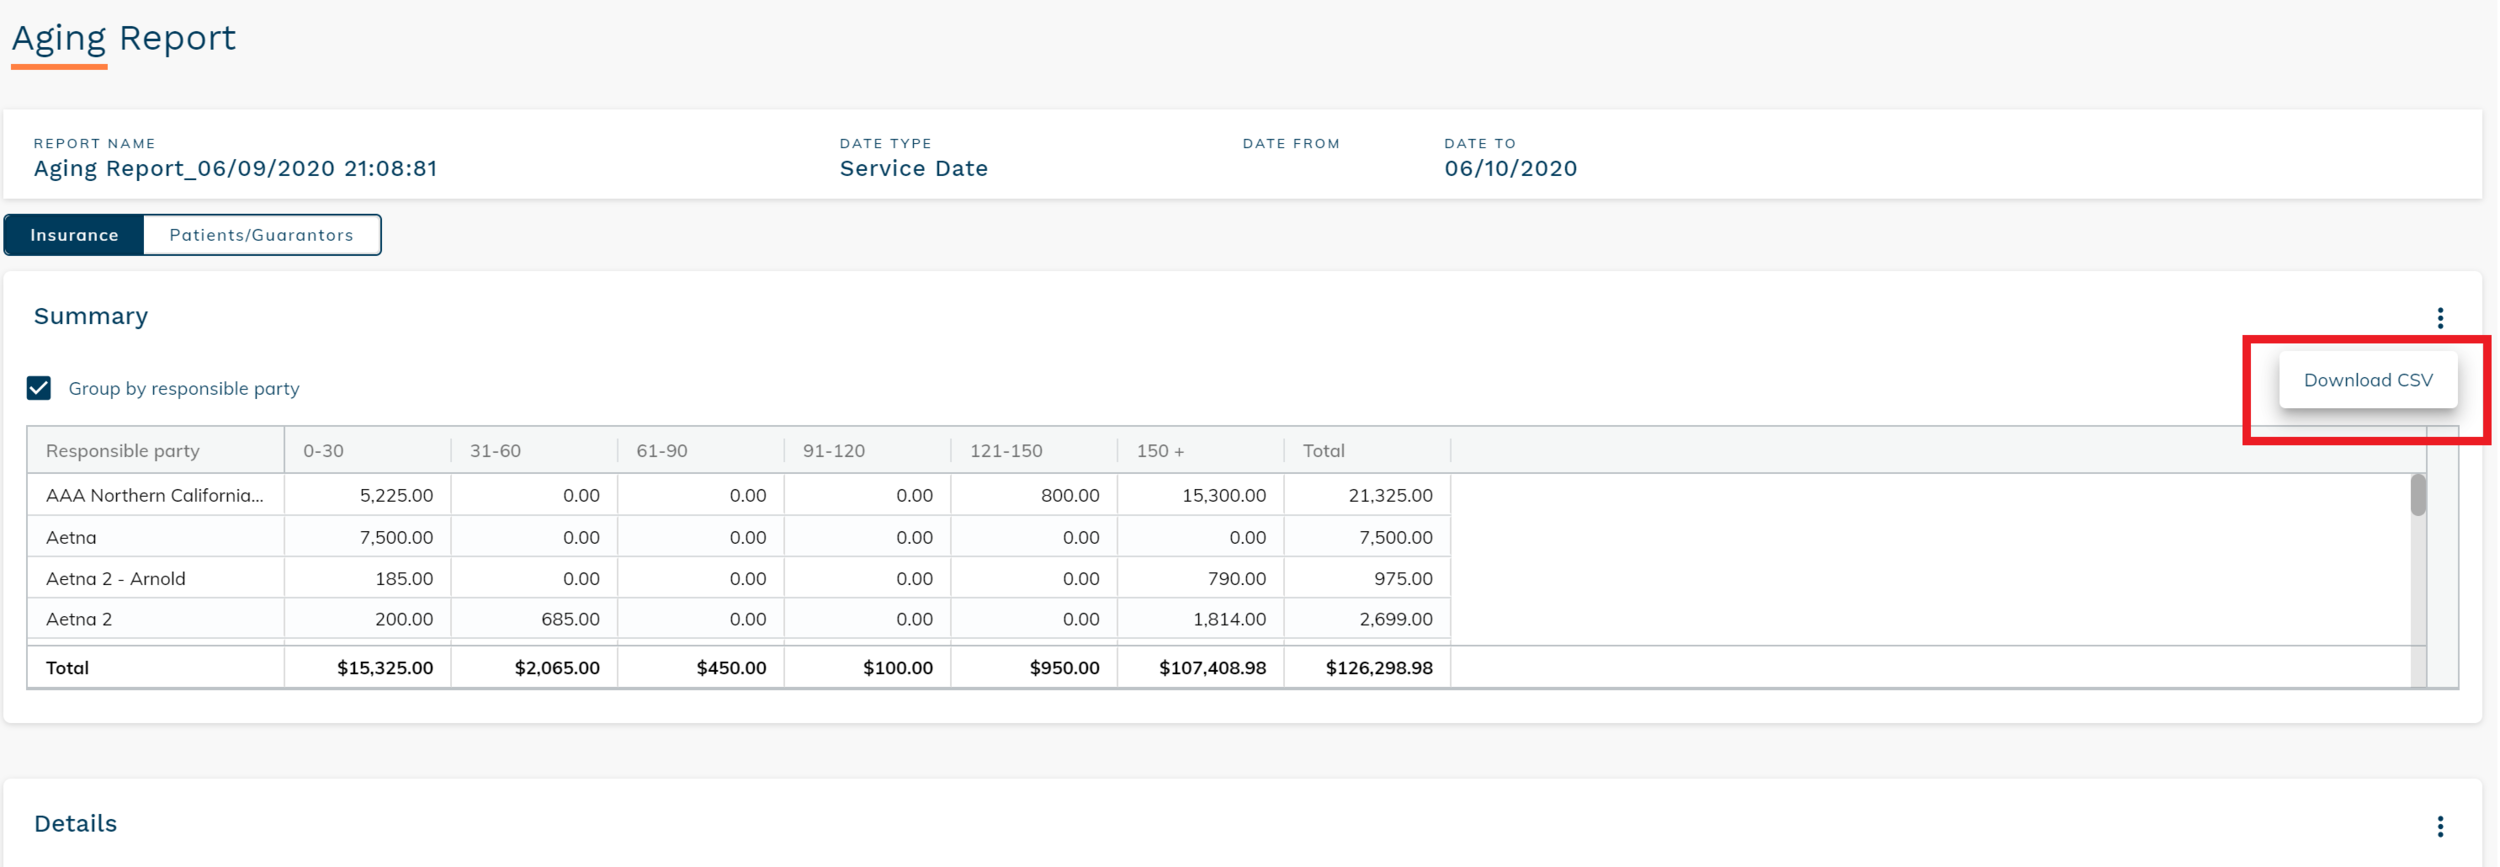
Move the toggle to the Patients/Guarantors side. The Aging report will display the Patients/Guarantors aging data.

Click on the Group by responsible party checkbox. As seen in the below images, the Summary will display the data according to each Insurance payer or Payer/Guarantor based on the toggle.

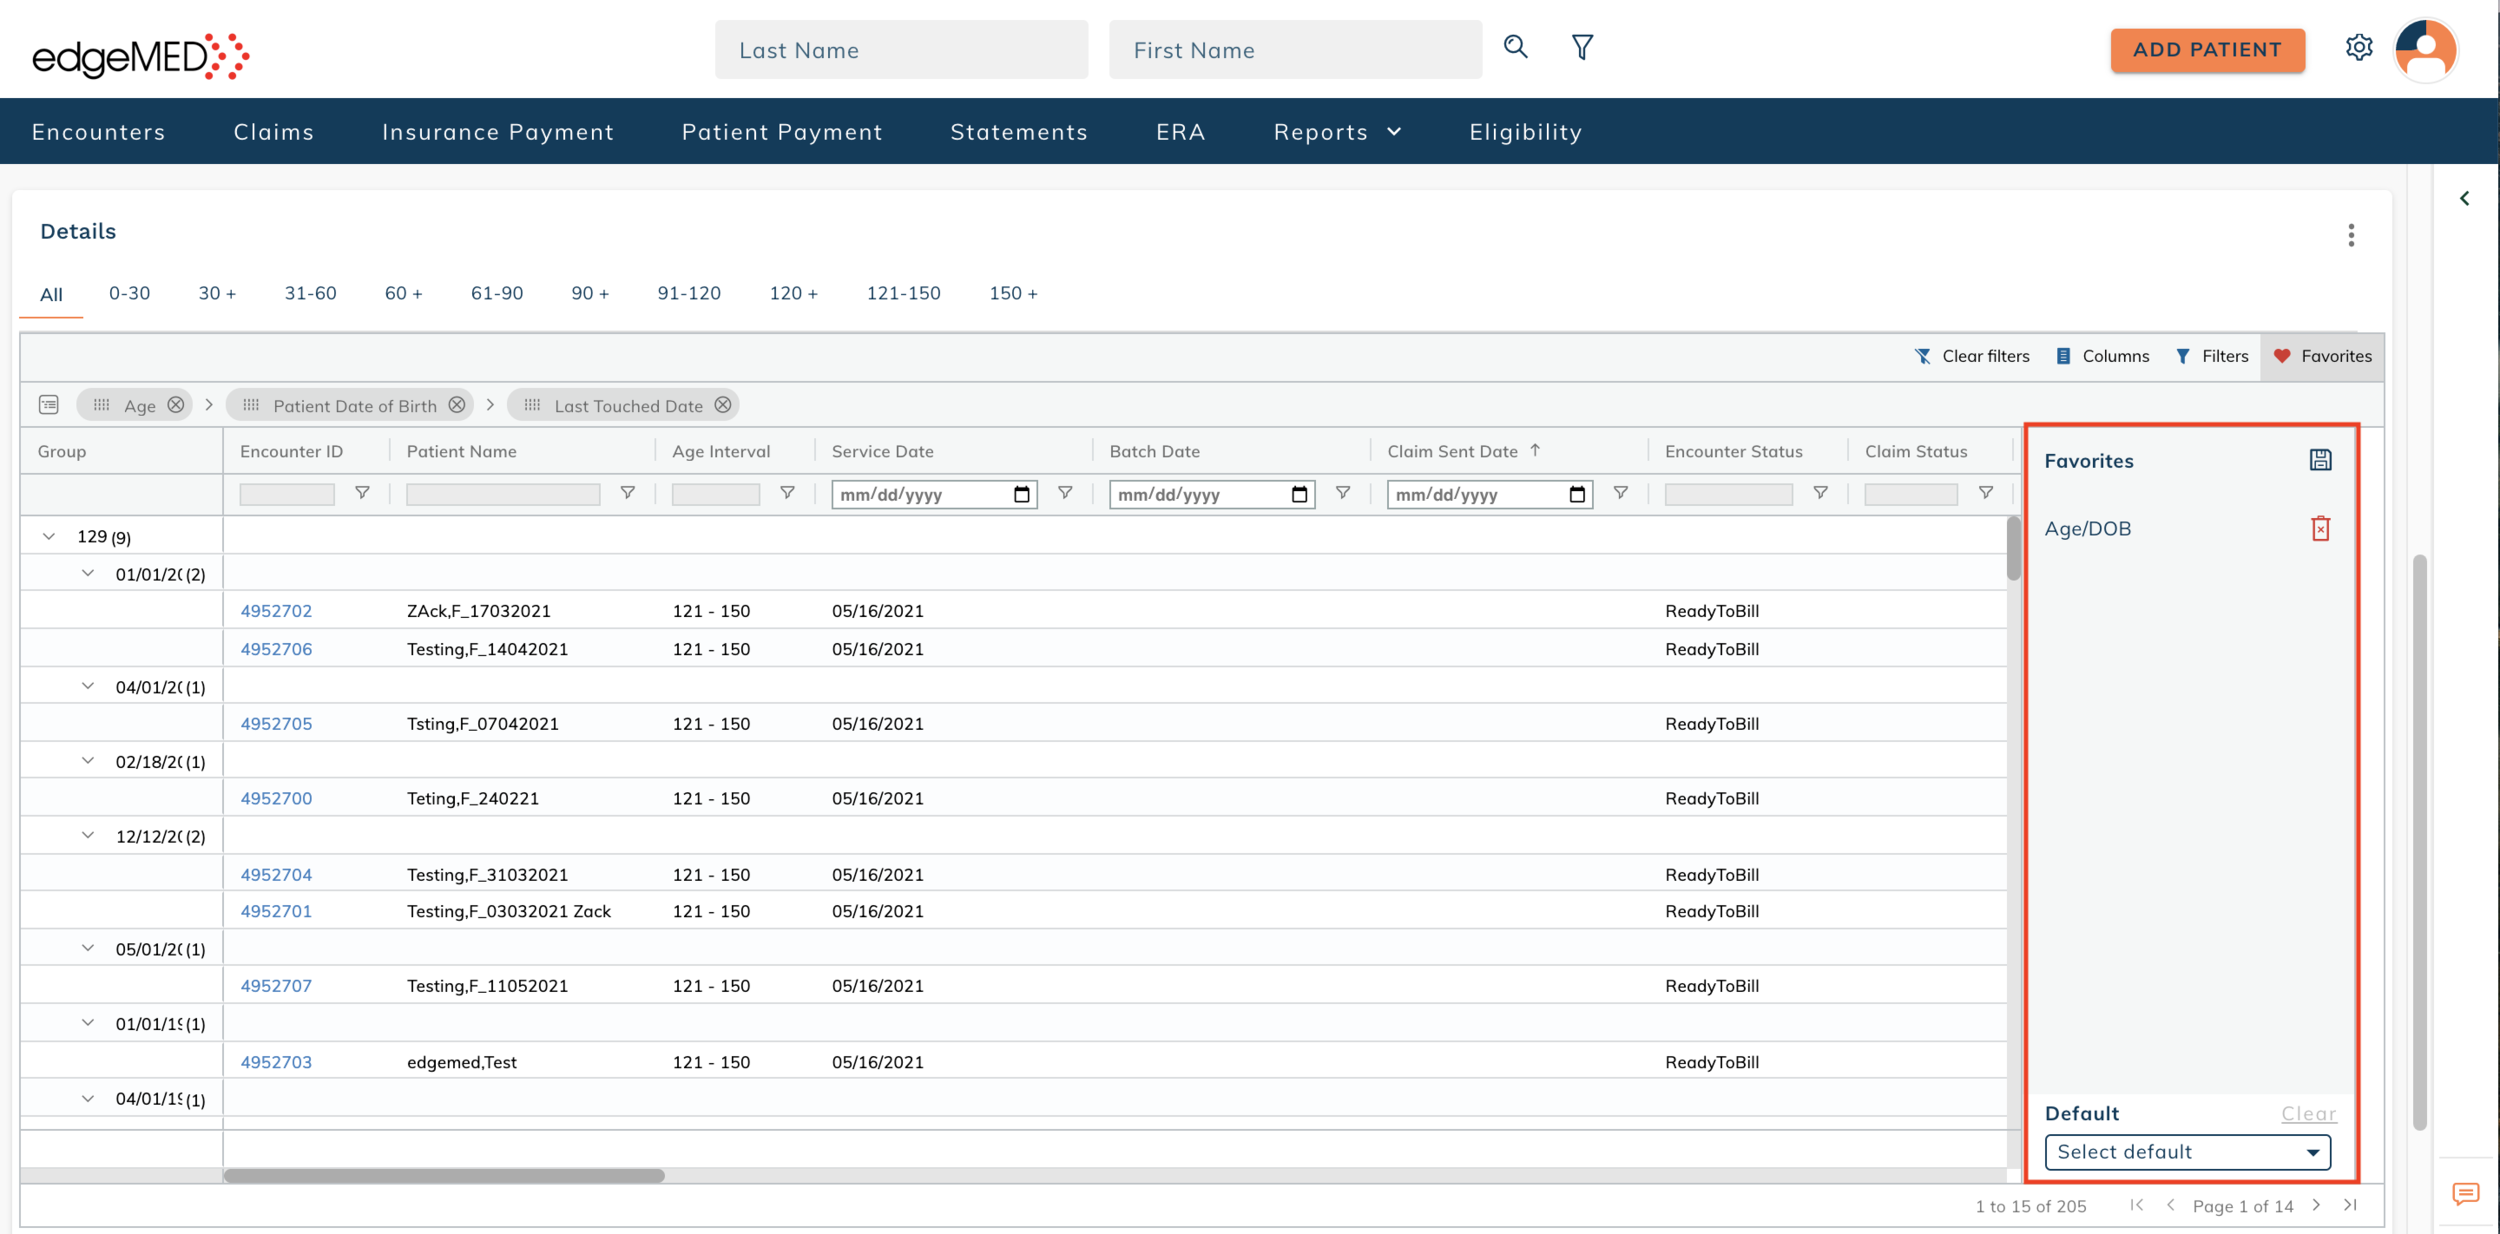
Click on the Columns tab to remove or add columns.

Click on the Filters tab to filter any column or use the filter icon under the column header to filter each column (as seen in the image below).


Schedule the Aging Report
Easily schedule an Aging Report to run monthly on a date of your preference. This avoids having to remember to run it every month to analyze the trends in the aging data, as this process happens automatically.

Click Schedule.

Select the First day of the month to run the aging report on the first day of every month or select the Last day of the month to run the aging report on the last day of every month. Or,
you can select the day from the drop-down containing values between 2 and 27.
When ready, click Schedule.

This Aging report will be generated on the selected day of every month and added to the top of the table.